

Looking at our racial demographics
A graphical depiction of the school, county, state and nation’s demographics by race
February 17, 2020
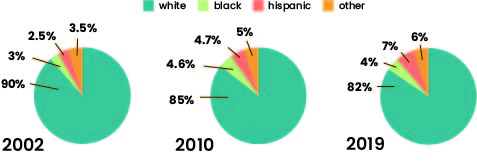
Each year, every public school in Kansas must publish basic information about its student body, including the breakdown of certain racial groups. The school’s percent of no-white students has increased by almost 10% since the school opened in 2000. Sources: Principal’s Report & Kansas Building Report Card 2018-2019.
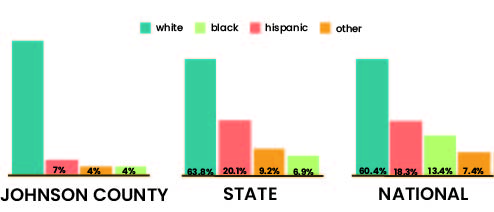
Results from the 2019 census of different racial groups shows Mill Valley closely mirrors the state of Kansas. Source: United States Census Bureau
(Visited 141 times, 1 visits today)